
Wow. A VP of Rogers Communications personally wants me to be a Rogers customer again. I know because he sent me a letter. Well, when I say “letter” I guess you might call it an ad on cardboard. And when I say “personally” I guess I should admit it’s addressed to “Resident” at my address not to my name. I’m not quite sure why it took him so long. After all, we cut our cable service in mid-2013, almost a year ago. It’s a very Canadian letter. It says, “We know you had your reasons for leaving Rogers.” Well, that’s certainly true. Having our cable costs increase 53% in fewer than 10 years was one of them. Another big one is that we weren’t getting any channels for that money that we watched that we couldn’t get for free using an Over the Air antenna. The letter continues by saying “If you’re at all open to reconsidering your decision, please let us know.” And it lists a toll-free number to call. Really. They think I want to phone them to chat about their various packages? Do they not remember that they told me I had to get a lawyer’s power of attorney before they would let me talk to them to cancel our cable service that was in my husband’s name? I did quickly check their website. They’re not advertising “pick your favourite 10 channels for $10.” Until they are, it’s highly unlikely I’ll be calling them. There are at least 2 other reasons, too:
1: What Rogers Spends Your $25-115 Internet Connection Fee On: Duct Tape and a Very Long Stick
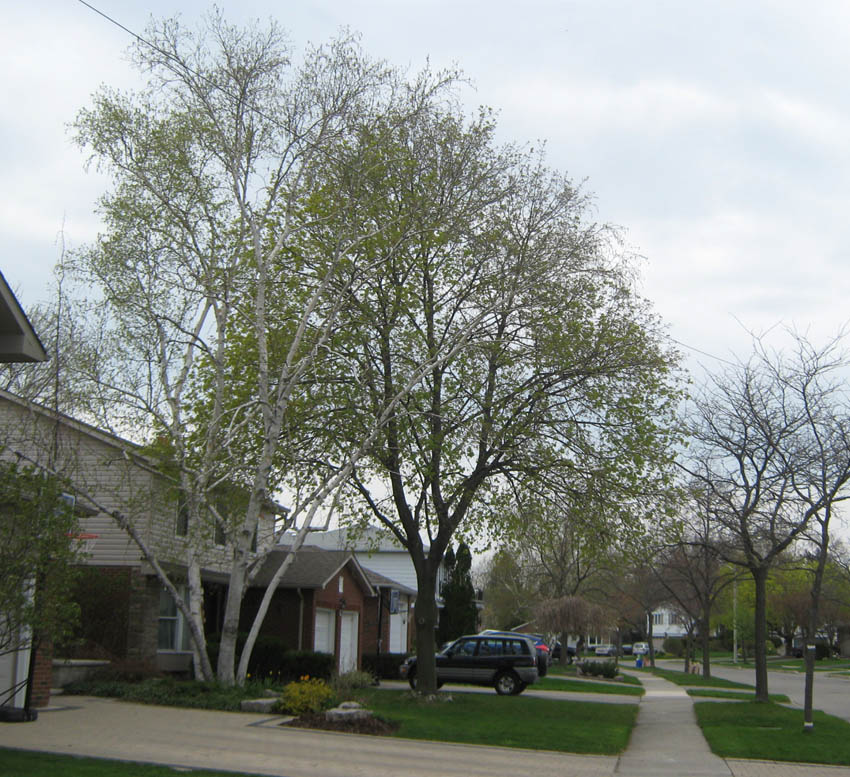 Look for the white duct tape tree then follow the cable up to the top left of the photo. In the neighbourhood where I walk to work, I’ve been watching white and black duct tape rings appearing on the trees. It’s not to repair ice storm damage or to trap Emerald Ash Borer larvae. It’s just Rogers “installing” and repairing its cable lines for high quality telephone, TV and internet access.
 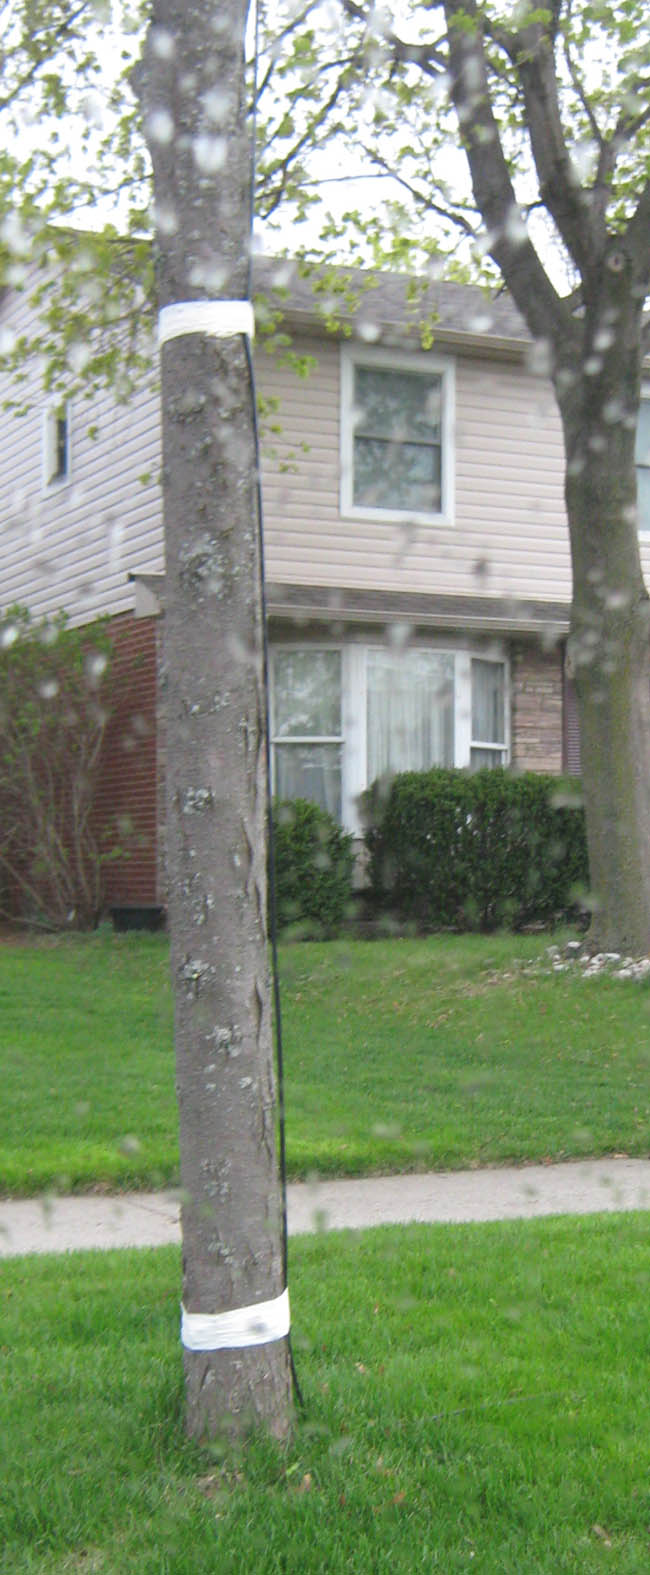 That’s right. Their lauded service includes running a cable, probably coax by the look of it, from their in-ground box loosely across the grass, then up the nearest city-planted street tree. The cable is attached to the trunk with two bands of duct tape. Then it winds through the branches and arcs over to another tree, this one belonging to a homeowner. Then it arcs over again to the house it is servicing.
 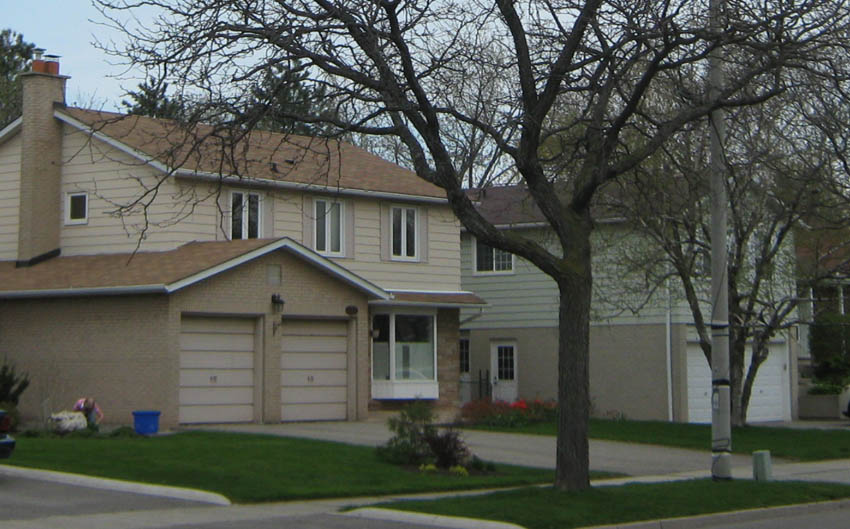 I’m not at all sure the city knows that Rogers is using city street light poles for its cable. Yes, eventually Rogers will send someone out to properly run these cables underground. They will even slice through various homeowners’ asphalt (at the end of the driveway owned by the city) to do it. Based on last year, I expect them to get right on it in about 6 months.
 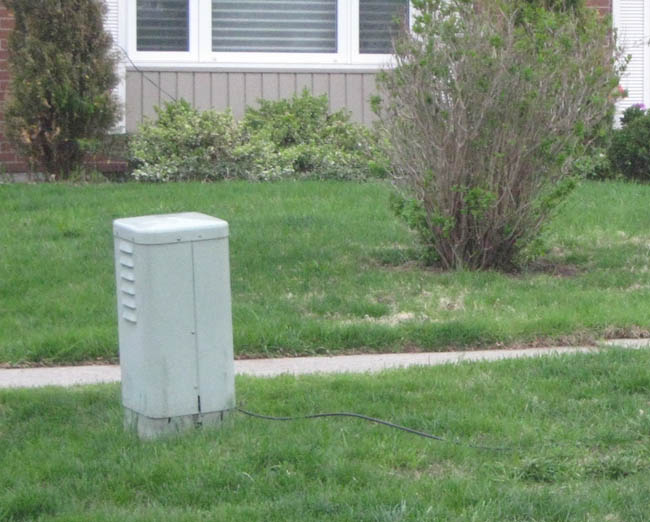 Notice the artistic tripping hazard of the cable on top of the grass. Yes the ground has been thawed for two months, long before this loop was run. In the meantime, your high speed internet access and digital TV is at the mercy of lawnmowers, falling branches, passersby with some attitude and a hockey stick to reach high overhead, and your neighbour who might decide to take down the tree that is serving as a distribution pole.
 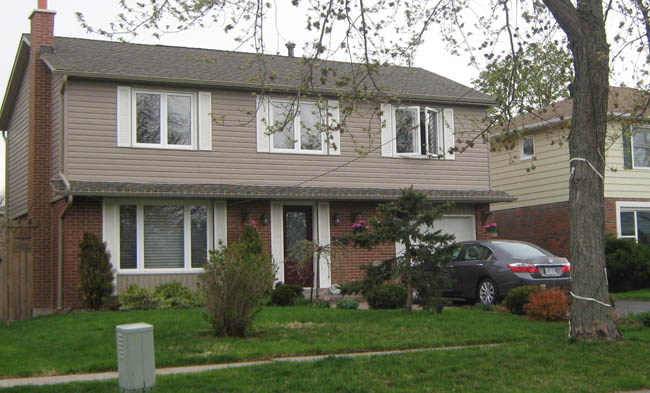 Not my idea of “best in class” service. Rogers “fine print” says for their internet packages they charge: “a $14.95 one-time activation fee, and a one-time installation fee (Self $9.99; Basic $49.99; or Professional $99.99).” For their TV packages it says: “One-time installation fee of $49.99 may apply.” These prices were on their website on May 12, 2014.
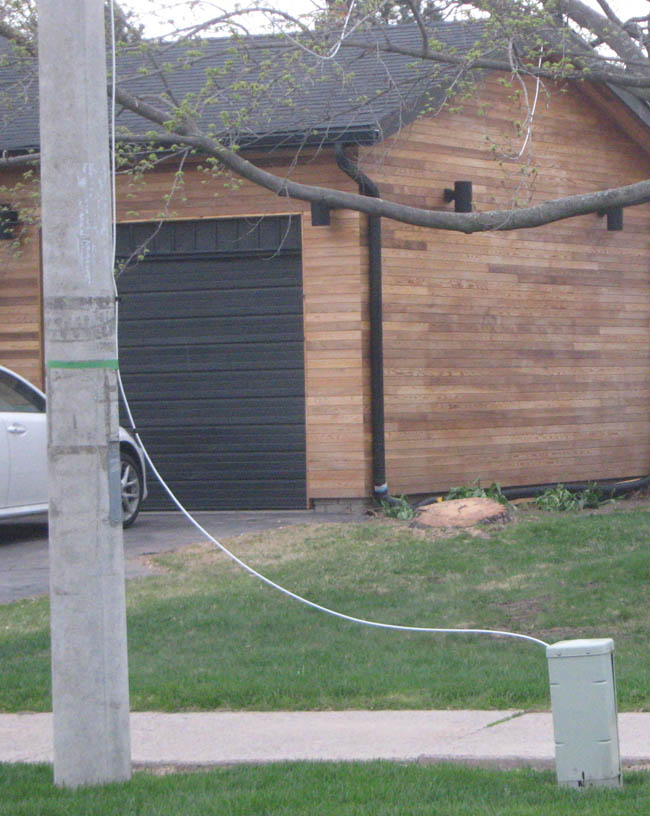
2: Rogers NETFLIX Speed Is Also Not a Plus
In a strange timing coincidence, there’s also an article on the CBCNews site today in which NETFLIX reports that the average download speed for Rogers customers was 1.67 Mbps. By comparison, Bell Fibe averaged 3.19 Megabits per second in April 2014. We don’t have a NETFLIX account although we’ve considered getting one eventually. If Fibe is really almost twice as fast as Rogers that would be an important factor in picking a data provider.
Sorry Mr. Perrotta but I Won’t Be Calling Soon
All things considered, I don’t expect to be giving Rogers the opportunity to earn back our business any time soon.  My relative’s pet rabbit loved chewing through the phone line inside the house: I hope this wild Cottontail doesn’t like Cable!
Related Reading
Join In Do you do Rogers? Or have you come up with an acceptable alternative? Please share your views with a comment.